


Abstract
Crude oil and pigged wax from the Montney formation in Canada are known to have high wax appearance temperatures (WAT), which leads to severe wax deposition problems during oil production and pipeline transportation. To address this issue, a variety of commercial wax inhibitors (WIs) and wax dispersants (WDs) were systematically studied. These chemicals were tested in both the raw crude oil and in specially prepared reconstituted oils (created by adding pigged wax back to the crude oil or using a dodecane-based model system). The goal was to reduce wax build-up using lab-based screening techniques that mimic field conditions as closely as possible.
Introduction
Crude oil and gas condensates contain heavy components known as paraffins—these are long-chain hydrocarbon molecules that can form wax. When the temperature drops during oil production or transportation through pipelines, these paraffins can solidify and form wax deposits. This wax buildup can clog pipelines, reduce flow, and lead to costly operational issues.
Definition of wax appearance temperature WAT
Wax Appearance Temperature (WAT) is the temperature at which wax crystals first begin to form in crude oil as it cools down. When oil reaches this point, solid paraffin waxes start to come out of solution and form tiny crystals, which can lead to deposits in pipelines and equipment. WAT is critical for designing and operating oil production and transportation systems, especially in cold environments.
Determination of WAT & WDT
WAT is usually determined in laboratories using different techniques to observe the first sign of wax formation. Similarly, Wax Disappearance Temperature (WDT) is the temperature at which all visible wax crystals dissolve back into the oil. Knowing both WAT and WDT helps operators understand the full range of temperatures where wax may be a problem.
Read more About Fishkill Town Board Candidates
Measuring methods for detecting the Wax Appearance Temperature (WAT)
Cross Polarisation Microscopy CPM
Cross Polarisation Microscopy (CPM) is a method used to visually detect wax crystals as they appear. The crude oil sample is cooled and observed under a microscope with polarized light, which makes the crystals visible.
Advantages and disadvantages of the CPM method
Advantages
- Visual confirmation of wax formation
- Simple and direct method
- Useful for different types of crude oils
Disadvantages
- Requires skilled operator
- Limited accuracy at high pressures
- Time-consuming for frequent tests
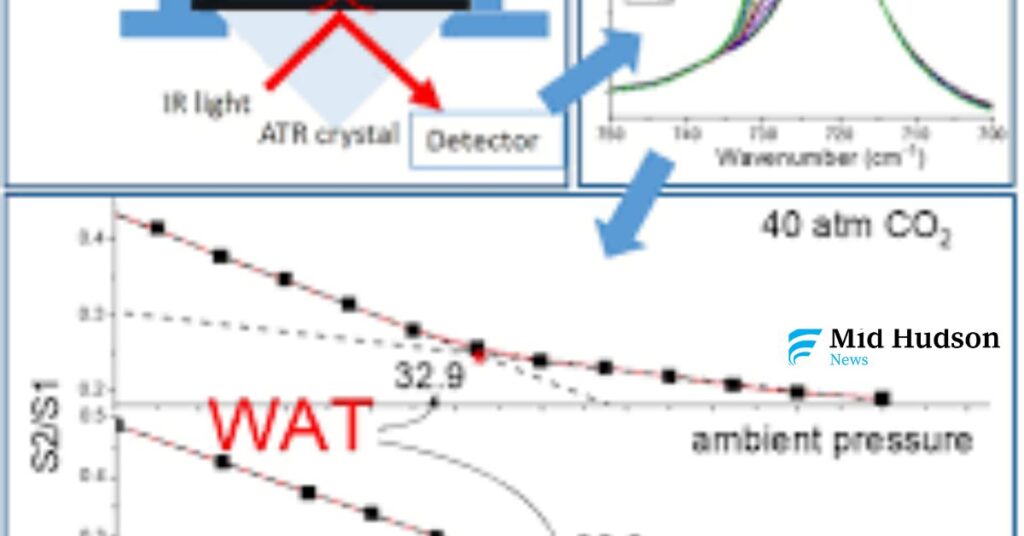
Optical WAT Detector OWD
The Optical WAT Detector (OWD) is a modern technique that uses sensors to detect changes in the optical properties of oil as wax crystals form. This method doesn’t require a microscope.
Advantages and disadvantages of the OWD method
- Fast and less operator-dependent
- Can be automated for real-time monitoring
- High sensitivity
Differential Scanning Calorimetry DSC
Differential Scanning Calorimetry (DSC) measures the heat flow into or out of a sample as it is heated or cooled. WAT is identified by a change in heat flow, which occurs when wax begins to crystallize.
Advantages and disadvantages of DSC method
- Provides quantitative data
- Can be used for a variety of crude oil types
- Reliable and repeatable
Disadvantages:
- Expensive equipment
- Requires trained personnel
- May not detect very small wax amounts
You might also be interested in New York Town Council Election Results
Wax, paraffine and wax deposits in crude oil
Wax and paraffin are common in crude oil and can cause significant problems. When wax deposits on pipeline walls, it reduces flow efficiency and can eventually block the pipe.
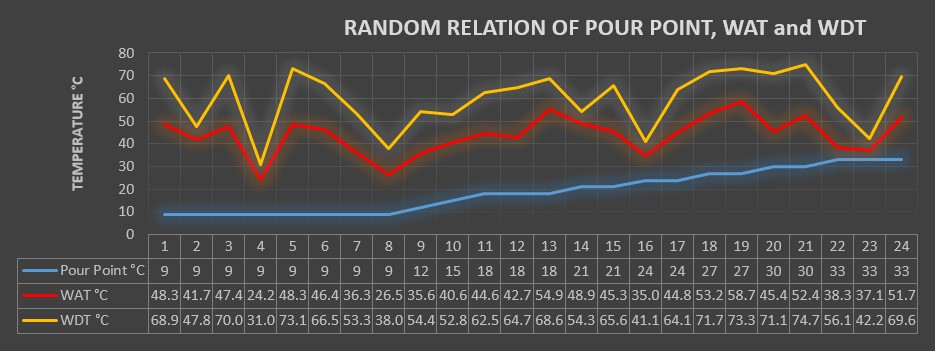
Wax Deposition Temperature WDT
WDT is the temperature where wax crystals that had formed start to dissolve. It’s important for planning heating strategies and flow assurance.
Wax Appearance Temperature [WAT]
WAT marks the beginning of wax formation and is essential for predicting when and where wax deposition may begin in the production or transport system.
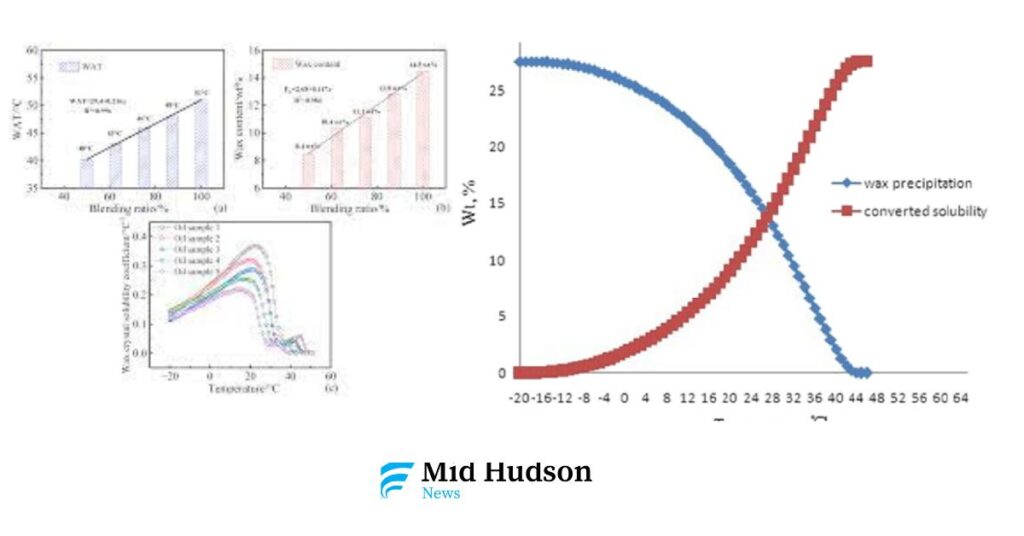
How it works
As crude oil cools, the solubility of wax decreases. At WAT, wax molecules start coming out of solution, forming solid crystals. This change affects flow and can lead to blockages.
Wax Dissolution Temperature [WDT]
The WDT is reached when enough heat is added to dissolve all wax crystals back into the oil. The system needs to be heated above WDT to completely clear wax deposits.
High-Pressure CPM Technique
This is a version of CPM used at higher pressures to simulate real pipeline conditions. It provides more accurate data for deep-sea or high-pressure environments.
How it works
Under pressure and with controlled temperature, crude oil is observed as it cools. WAT is identified by the first appearance of wax crystals under polarized light.
Fluid Analysis
Involves studying the components of crude oil to predict its behavior.
Asphaltenes
These are heavy molecules that can affect wax behavior and must be analyzed alongside wax content.
Separation
The process of isolating wax, asphaltenes, and resins from crude oil for accurate testing.
Gas Hydrates
Solid crystals formed from water and gas, different from wax but also cause blockages.
Oilfield Scale
Mineral deposits that can combine with wax and worsen flow problems.
Rheology
Study of crude oil flow behavior, especially how wax affects viscosity and yield stress.
Wax Appearance
Visual detection or measurement of the temperature at which wax starts forming.
Wax Deposition
The actual build-up of wax inside pipelines, which reduces flow and increases operating cost.
Arn Acids
A class of organic compounds present in crude oil that can influence wax behavior, though less commonly discussed.
There are two main types of petroleum wax:
- Macrocrystalline wax (also called paraffin wax): made mostly of long, straight-chain molecules that form large, needle-like crystals.
- Microcrystalline wax: made from more complex molecules like branched or ring-shaped hydrocarbons. These form smaller, less regular crystals.
Understanding what kind of wax is in a crude oil and its chemical makeup is key to controlling wax buildup and preventing pipeline blockages.
Researchers use several scientific principles—like molecular dynamics, heat and mass transfer, and thermodynamics—to study how wax deposits form. Even though this is a complex problem and data is limited, scientists have identified some main ways wax moves and forms in oil, such as:
- Molecular diffusion
- Brownian motion (random particle movement)
- Soret diffusion (movement caused by temperature differences)
- Gravity settling
- Non-Newtonian flow behaviors
- Heat transfer (as oil cools)
- Gel nucleation (wax forming into gel)
Key Factors That Affect Wax Formation:
- Oil Density: Heavier oils tend to contain more wax-forming molecules and usually have a higher wax appearance temperature (WAT)—the point at which wax starts to form as the oil cools.
- Wax Content: The more wax a crude oil contains, the more likely it is to deposit under lower temperatures.
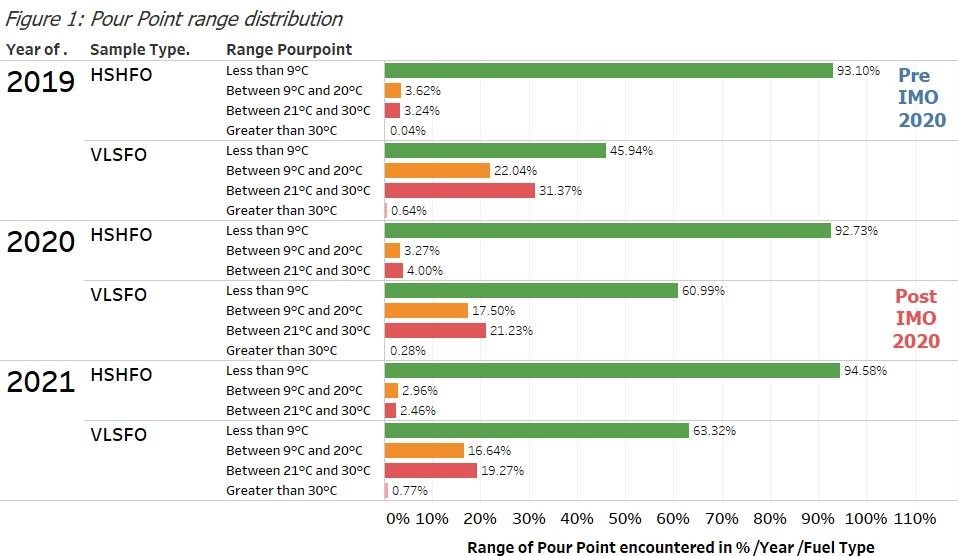
- Pour Point: The lowest temperature at which the oil can still flow. Once the oil goes below this point, it’s too thick to move easily.
- Temperature Changes Over Time: As oil sits in pipelines or tanks and the temperature drops, wax builds up and becomes harder and rougher over time.
There are many ways to measure wax content, including:
- UOP 46–64 method
- Gas Chromatography (GC)
- Density-based techniques
- Pulsed Nuclear Magnetic Resonance (NMR)
Wax Appearance Temperature (WAT)
WAT is the temperature at which wax starts to form in oil. It’s one of the most important factors in predicting wax problems in pipelines. WAT depends on the origin of the oil and its chemical composition. If WAT is high, wax will form sooner as the oil cools.
Problems caused by wax include:
- Damaged wellbores and pipelines
- Lower production rates
- Blockages in processing and transport systems
Model Development
In this research, scientists used artificial intelligence (AI) and machine learning (ML) to predict WAT more accurately. They collected a dataset with many variables (like pour point, wax content, oil density) and used models like:
- Least Squares Support Vector Machine (LSSVM)
- Recurrent Neural Network (RNN)
- Adaptive Neuro-Fuzzy Inference System (ANFIS)
The process included gathering data, analyzing the distribution of variables, applying AI algorithms, and testing prediction accuracy.
Results and Discussion
The performance of each AI model was measured using several statistical tools:
- Coefficient of Determination (R²)
- Root-Mean-Square Deviation (RMSD)
- Standard Deviation of Errors
- Average Absolute Relative Error
Author Contributions (CRediT Statement)
- Maryam Mahmoudi Kouhi: Draft writing, visualization, software, methodology, and analysis.
- Ali Shafiei: Editing, supervision, funding, project leadership.
- Taira Bekkuzhina: Draft writing, visualization, and analysis.
- Munziya Abutalip: Editing, supervision, and project support.
Declaration of Interest
The authors declare they have no conflicts of interest related to this research.
Acknowledgments
This research was supported by Kazakhstan’s Ministry of Science and Nazarbayev University. The authors also thank the peer reviewers for their helpful comments.
Testing Overview
Different types of wax control chemicals were examined:
- Wax Inhibitors (WIs):
- Ethylene vinyl acetate (EVA)
- Alkylphenol formaldehyde resin (AFR)
- Acrylic copolymer (AC)
- α-Olefin maleic anhydride copolymer (AOMAC)
- Wax Dispersants (WDs):
- Surfactant-based formulations
The evaluation process involved several laboratory tests:
- Pour Point Tester: To determine pour point and Detected Wax Appearance Temperature (DWAT).
- Multiple Light Scattering (MLS): To examine wax dispersion behavior in oil.
- Capillary Flow Through (CFT) System: To test dynamic wax deposition under controlled low flow.
- Dynamic Flow Loop (DFL): A more advanced system to simulate field-like flow conditions and observe wax behavior dynamically.
Key Findings
- Reconstituted oils had higher WATs (above 55°C) compared to the original crude oil, making them more prone to wax issues.
- EVA was highly effective in lowering DWAT and pour point in crude oil, but not effective in the more wax-rich reconstituted oil.
- AFR and AC showed moderate improvement, but the standout performer was AOMAC, which significantly reduced DWAT in the reconstituted oil.
- Surprisingly, surfactant-based dispersants also helped lower DWAT in the wax-heavy model oil.
- The top-performing inhibitors and dispersants were tested in the CFT system. For crude oil at 10°C, 225 ppm of AOMAC effectively reduced wax deposition. A lower dosage was sufficient in the more dynamic DFL system.
- When WIs and WDs were used together, wax deposition was even further reduced, especially in the reconstituted model oil.
- MLS and bottle tests showed that WDs helped to keep wax particles dispersed in both oil and water phases, suggesting they play a dual role in wax management.
Conclusion
WAT can be measured in the lab, but many current methods are either slow, expensive, or prone to error. This study developed three intelligent models—LSSVM, RNN, and ANFIS—to predict WAT based on key oil properties. Using data from 81 samples, the models showed promising results in estimating WAT accurately.

